Search Results
38 results found with an empty search
- Team Members | Midwest Workforce Strategies
The Midwest Workforce Strategies team: Ron Cox, Deb Sellers, Alex Sanchez Rangel, William Pikturna Team Members Your Workforce Strategy Partners Ron Cox President Keynotes Strategy Workshops Data Analytics READ MY BIO Deb Sellers Vice President Generations Indiv. with Disabilities Business Operations READ MY BIO Alex Sanchez Rangel Global Immigration Specialist Immigration Law International Strategies Diverse Workforce William Pikturna Web Development Associate Website Testing Restricted Access Pages Youth Programs Support Midwest Workforce Strategies is built on a foundation of diverse expertise. Our team combines backgrounds in aerospace engineering, human resources, economic development, immigration, productivity improvement, STEM programs, strategic planning, operations, and data analytics to provide a comprehensive view of the labor market. We do not rely on standard recruiting tactics; we use mathematical modeling and operational rigor to help your organization out-maneuver the competition.
- Northeast Region Data | Midwest Workforce Strategies
Select a northeast region county and Workforce Vector data is displayed. States include Maine, New Hampshire, Vermont, Connecticut, Rhode Island, Massachusetts, New York, New Jersey, Delaware, Maryland, West Virginia, Virginia, Ohio, Pennsylvania, and the District of Columbia. Northeast Region Workforce Vector Data Type your county name in the dropdown menu and then select it from the list. Workforce Vector data for your county will be displayed in the tables. [See Note A below.] Workforce Vector FAQs, definitions, and notes are included beneath the Workforce Vector tables. These pages need to be viewed on a desktop computer. The mobile-friendly version is still in development. NOTE: This is PRELIMINARY data and is subject to change . [See Note B below.] Jump to the Midwest Region Jump to the South Region Jump to the West Region Workforce Element Definitions Workshop Materials Filter by County County: General Information 0.1 Population 0.2 Population 16+ 0.3 Civilian Labor Force 16+ County Total County: Employee Output/yr 1.1 Capital Investments 1.2 Labor Composition 1.3 Process Improvements % GDP/yr Rank ENE/yr Workforce Potential/yr County: Retention/yr % Emp./yr Rank Employed/yr Workforce Potential/yr 2.1 Quits and Discharges/year 2.2 Layoffs/year 2.3 Out-Migration Rate/year Population Population Population Population Population Population Population Population County: Not in Labor Force % Not in LF Rank # Not in LF Workforce Potential 3.1 Students 14-15 [ Warning! See notes.] 3.2 Non-Students 16-19 3.3 Students 16-19 3.4 Females 20-54 3.5 Males 20-54 3.6 Individuals 55-74 3.7 Females with Children < 6 3.8 Foreign Born - Naturalized Citizens 3.9 Foreign Born - Not a U.S. Citizen 3.10 Individuals with a Disability 3.11 Indiv. Experiencing Homelessness 3.12 Indiv. with Income < Poverty Level 3.14 Individuals Recently Incarcerated 3.15 Latinos 3.16 Part-time Employees 3.17 Unemployed [See notes.] 3.18 Veterans 3.19 Volunteers (FTE) 3.13 Indiv. without a College Degree Population Population Population Population County: Employed Elsewhere % Base Rank Employed Workforce Potential 4.1 In-commuters 4.2 Out-commuters [ Warning! See notes.] 4.3 Remote Workers 4.4 In-state Migration/year 4.5 Out-of-state Migration/year 4.6 International Migration/year 4.7 Refugees/year 4.8 Contract / Temp Workers 4.9 Part-time to Full-time Employees 4.10 Poaching/year 4.11 Second-job Employees 4.12 Self-employed Individuals Population Population Population Population Population Population Population Population Population Population Population Population Population Population Population Population County: Future Employees % Base Rank Total Workforce Potential 5.1 Apprenticeships/year 5.2 Internships 5.3 Youth Programs Population Population Population Population FAQs How can I learn more about what these numbers mean? There are a number of resources on the site to help explain the Workforce Vector and how it is used to help organizations grow their workforce. The 40 workforce elements (the rows in the tables above) are described here . The potential to increase employment of each type of individual is described here . Can we talk about how this can help me find employees? If you would like to have a brief conversation about how this data can be used to increase or retain your workforce, send me an email at ron.cox@midwestworkforce.com or contact me through my website contact form . How accurate are these numbers? CAUTION! The numbers provided here are approximations and should only be used to get a sense of local conditions and possibilities. The data should only be used to compare and contrast options and to guide the user as they explore more local and more timely information. The data is not exact for the following reasons. The Federal data are approximations based on surveys. All values have an error bound, meaning the result displayed is the best estimate but there is a chance the actual value is different, but within some error bound. For instance, a county estimate for a group size could be 120 with a margin of error of 75. The value 120 is the estimate of the group size (displayed in the table above) and the 75 is the margin of error. See www.bls.gov for more information on margins of error and confidence level. Error margins are not included in the table above. Note that the accuracy of the estimates tend to be better (lower margin of error as a percent of the estimate) for larger populations where the sampling size is larger. Estimates for low population counties tend to have much higher error ranges as a percent of the estimate. Five year averages are given for the majority of the values in the table. This is done to reduce the short-term fluctuations in the data and because data is not released annually for small counties because of the small sample size. Some data is not known at the county level, so statewide or national values for some variables are used in conjunction with local data (if available) to estimate local conditions. The errors in these estimates are greater when local conditions differ significantly from the state or national averages used in the calculations. Definitions (*): An asterisk indicates the workforce vector values shown (except for the potential) are an average of a portion of the counties in the state. This generally arises for small counties when Federal data is not available. See the FAQs (above) and the specific workforce element note (below). ENE: Equivalent New Employees per year. FTE: Full Time Equivalent. Labor Force: Individuals employed and unemployed. NA: Data not available. NILF: Not In the Labor Force % Not in the LF: The fraction of the civilian population 16+ that is not in the labor force. They are not employed nor are they unemployed. Population: Table entries marked as 'Population' are currently being created and will be updated over the next several months. RUCC: Rural-Urban Continuum Codes. Workforce Potential: The number of additional individuals that might be able to be pulled into a county's labor force if productivity, hiring, and retention rankings are improved by 10% from the median county values. Rank: The county place within all U.S. counties in terms of the percent employed. 1% = Top 1% (highest fraction employed or lowest fraction not in the LF); 100% = 99-100% (lowest fraction employed or highest fraction not in the LF). Workforce Element Notes Alphabetical general notes are listed first. These are followed by notes specific to each workforce element. Additional information will be added to the notes in the coming months. Notes will change over time as research continues. [A] The government combines some data areas so your ‘County’ name listed here may be slightly different. This applies to Alaska, Connecticut, and Virginia. Data for U.S. territories is not included in this work. [B] This work is on-going research and will change over time. All of the numbers presented here have errors of varying magnitudes. These errors occur because of the statistical modeling used by those creating the data, by changes in data over time, by the use of national or state-level data for county level information when data at the local level is not known, and by estimates made by the author when certain information is not known at the local level. See the FAQs above for more information. Some estimates of workforce element data are questionable and extreme caution should be used. Typically this occurs when there are very large variations in a quantity and the definition of the term and the actual data gathered by BLS or the Census Bureau differs. Additional errors can occur when local data is not available and state or national averages are used to arrive at an order of magnitude for a term. An example is Out-commuting. See 4.2 below. 0.1 Average of 2018-2022 county data. Population 0+ years old. 0.2 Average of 2018-2022 county data. Population 16+ years old. 0.3 Average of 2018-2022 county data. Civilian employed and unemployed 16+. 1.1 Annual data. Least-square linear fit to 2013-2022 state productivity data. State data is adjusted slightly to approximate county-level productivity changes. A limiter is applied to an annualized 2013-2023 GDP/hr county estimate to constrain the variation off of the state average. Annualized percent changes in county GDP/hr are split into capital, composition, and TFP components by assuming every county looks like the national average splits. The county estimate for capital may be higher or lower than the value shown because of the county mix of industry, labor, and other factors compared with the national and state averages of industry, labor, and other factors. The equivalent number of new employees is the percent GDP/hr change multiplied by the employment level (2018-2022 data). Base population = Employed 16+. 1.2 Annual data. Least-square linear fit to 2013-2022 state productivity data. State data is adjusted slightly to approximate county-level productivity changes. A limiter is applied to an annualized 2013-2023 GDP/hr county estimate to constrain the variation off of the state average. Annualized percent changes in county GDP/hr are split into capital, composition, and TFP components by assuming every county looks like the national average splits. The county estimate for capital may be higher or lower than the value shown because of the county mix of industry, labor, and other factors compared with the national and state averages of industry, labor, and other factors. The equivalent number of new employees is the percent GDP/hr change multiplied by the employment level (2018-2022 data). Base population = Employed 16+. 1.3 Annual data. Least-square linear fit to 2013-2022 state productivity data. State data is adjusted slightly to approximate county-level productivity changes. A limiter is applied to an annualized 2013-2023 GDP/hr county estimate to constrain the variation off of the state average. Annualized percent changes in county GDP/hr are split into capital, composition, and TFP components by assuming every county looks like the national average splits. The county estimate for capital may be higher or lower than the value shown because of the county mix of industry, labor, and other factors compared with the national and state averages of industry, labor, and other factors. The equivalent number of new employees is the percent GDP/hr change multiplied by the employment level (2018-2022 data). Base population = Employed 16+. 2.1 Annual data. On-going research. 2.2 Annual data. On-going research. 2.3 Annual data. Average of 2018-2022 county data. Fraction of the population 0+ that out-migrates each year. The number of out-migrators is adjusted lower by the identical amount in every county, by a national estimate, to approximate the number of employees that leave each county annually. This is on-going research and this number may be adjusted lower. Base population = population 0+. 3.1 The Students 14- to 15-years-old workforce element should be used with caution since there is very little research data available. The 14-15 population size is estimated from a 10-14 population value and a 15-17 value. The unemployment rate is assumed to be the same as the rate for the population 16-19, based on research prior to 2000. The employment participation rate is estimated to be a fraction of the 16-19 rate, based on research prior to 2000. There are many root causes associated with the 14-15 age group, which make it difficult for individuals to find employment. This group is much more likely than other groups to work part-time and part-year, which further limits the impact the group can have on the local labor force. Average of 2018-2022 county population data. Base population = Population 14-15 estimate. 3.2 Average of 2018-2022 county population data. Base population = Non-student population 16-19. 3.3 Average of 2018-2022 county population data. Base population = Student population 16-19. 3.4 Average of 2018-2022 county population data. Base population = Female population 20-54. 3.5 Average of 2018-2022 county population data. Base population = Male population 20-54. 3.6 Average of 2018-2022 county population data. Base population = Population 20-54. 3.7 Females 20-64 with children less than six years old. Average of 2018-2022 data. Base population = Civilian females 20-64. 3.8 Data is only available at the county level for large-population counties. This data, together with the state average, is used to compute an average value for the fraction of the foreign-born not in the labor force in the small-population counties. When error bounds lead to a large variation in the estimate for the small-county average, the NILF estimate is limited to 1.5 standard deviations (of all states) from the state average. An asterisk (*) is used to indicate when a small-county average is used. Small counties with industries that tend to hire more/fewer foreign-born individuals will likely have a greater/smaller value of those not in the labor force than indicated by the average. Average of 2018-2022 state and county population data. Base population = Foreign-born - naturalized citizen population 16+. 3.9 Data is only available at the county level for large-population counties. This data, together with the state average, is used to compute an average value for the fraction of the foreign-born not in the labor force in the small-population counties. When error bounds lead to a large variation in the estimate for the small-county average, the NILF estimate is limited to 1.5 standard deviations (of all states) from the state average. An asterisk (*) is used to indicate when a small-county average is used. Small counties with industries that tend to hire more/fewer foreign-born individuals will likely have a greater/smaller value of those not in the labor force than indicated by the average. Average of 2018-2022 state and county population data. Base population = Foreign-born - not a U.S. citizen population 16+. 3.10 Average of 2018-2022 county data. Base population = Individuals with a disability 18-64. 3.11 This data is for the sheltered homeless, which is about one-half of all individuals experiencing homelessness. Some of the sheltered homeless are in the labor force, so the number NILF is less than the total in shelters. There is no data at the state or county level on the fraction of the sheltered homeless that are not in the labor force. The value provided here is an estimate based on 1) state data (2018-2022) on the fraction of the state population in shelters, 2) national data on the fraction of the sheltered homeless 16+ years old (assumed to hold in all counties), 3) the national value for those in shelters who are not in the labor force (assumed to hold in all counties), and county data on the population 16+ (2018-2022). The workforce potential is computed using a different approach because of the lack of NILF data. The potential is the increase in labor available if homelessness decreases in comparison to peers. The potential value is low in part because some of those in shelters are already employed. Since the fraction of individuals experiencing homelessness tends to be higher in urban areas, urban data is likely under-estimated and rural data is likely over-estimated. Base population = population 16+. 3.12 Individuals with income less than the poverty level. Average of 2018-2022 data. Base population = Civilian labor force 16+. 3.13 Individuals without a college degree only includes those without a high school degree and those with a high school degree that did not complete any higher education courses. Individuals who completed some college-level courses but did not get a degree are not included. Average of 2018-2022 county data. Base population = Individuals 25-64 with high school as the highest degree. 3.14 On-going research. 3.15 Average of 2018-2022 county population data. Base population = Latino civilian population 16+. 3.16 Average of 2018-2022 county data. The 'Not in Labor Force' value is all individuals 16+ not in the labor force. It is assumed that individuals entering the labor force will distribute more favorably to part-time employment. Specifically, to the average of a) completely part-time and b) the county ratio of part-time to full-time employment. Base population = Population 16+. 3.17 Average of 2018-2022 county data. The unemployed are technically considered to be in the labor force. The other workforce elements in this category highlight those that are not in the labor force. That is, individuals who are neither employed nor unemployed. The county unemployment rate is shown in the '% Not in LF' column. Base population = Civilian population 16+. 3.18 Average of 2018-2022 county data. Base population = Veterans 18-64. 3.19 A verage of 2018-2022 county data on the population 16+. Volunteering rate is an average of 2017, 2019, and 2021 data. Volunteer data is only known at the state level so it is assumed that the county volunteer rate equals the state average. The non-volunteer rate is shown in the '% Not in LF' column. The '# Not in LF' and the Workforce Potential are converted to an equivalent, fully-employed person using the national average of the number of volunteer hours per volunteer. 4.1 On-going research. 4.2 The out-commuting workforce element is known to have large errors. Differences in remote work, hybrid work, and other work-location situations impact government survey results, so caution should be used when reviewing results. In addition, the ability to change commuting patterns can be difficult in certain situations. For instance, when a professional is commuting from a small county with poor job fit opportunities to a nearby metropolitan area. The ability to change this commuting behavior is less than what would be predicted by the perturbation methods used in this work to estimate potential changes. Average of 2018-2022 county population data. Base population = Employed 16+. 4.3 Average of 2018-2022 county data. Includes individuals who usually worked from home, so this includes some hybrid work. Remote work varies by industry, so variations in industry mix by county will affect the potential calculation. As such, the potential should be considered an upper estimate. Base population = Employed 16+. 4.4 Annual data. Average of 2018-2022 county data. The in-state migration rate is the number of individuals moving to the county per year from within the state, as a percent of the county population 1+. The in-state migration rate is a modified rate to adjust for states with (typically) one very large population county compared to the rest of the population in the state. The number of migrators is adjusted lower by an identical amount in every county, by a national estimate, to approximate the number of employees migrating. This is on-going research and this number may be adjusted lower. Base population = population 1+, adjusted for county population skew. 4.5 Annual data. Average of 2018-2022 county data. The in-migration rate is the number of individuals moving to the county from other states per year, as a percent of the county population 1+. The number of out-of-state migrators is adjusted lower by an identical amount in every county, by a national estimate , to approximate the number of employees migrating. This is on-going research and this number may be adjusted lower. Base population = population 1 +. 4.6 Annual data. Average of 2018-2022 county data. The immigration rate is the number of individuals moving to the county from other countries per year, as a percent of the county population 1+. The number of immigrates is adjusted lower by an identical amount in every county, by a national estimate , to approximate the number of employees migrating. This is on-going research and this number may be adjusted lower. Base population = population 1 +. 4.7 Annual data. Average of data from 2018-2022 for county population and from 2013-2023 for refugees/year. Assumes refugees are distributed proportional to the local population. When refugees arrive, they often are more concentrated in counties that have more Federal and local resources. See: https://www.acf.hhs.gov/orr/map/find-resources-and-contacts-your-state. Refugee estimates are likely over-estimated in counties with few resources and under-estimated in counties with more settlement resources. The number of refugees is adjusted lower by an identical (national) amount in each county to approximate the number of refugees that will be in the labor force. This is on-going research and this number may be adjusted lower. Base population = Population 0+. 4.8 On-going research. 4.9 Average of 2018-2022 county data. The potential is the conversion of current part-time employees to full-time employees, not new full-time employees from those not-employed. Base population = Full-time and Part-time/Part-year population 16+. 4.10 On-going research. 4.11 On-going research. 4.12 County estimates for the number of self-employed (SE) individuals with no employees are made by using 1) 2018-22 county data on the number of employed civilians 16+, 2) 2018-22 county data on the number of SE by incorporation status and gender, 3) 2015 national data on the fraction of the SE without employees by incorporation status, and 4) 2019 data on the fraction of the SE with no employees by gender. The potential value is likely an upper-estimate due to how industry mix affects the local self-employment rate. Whether a self-employed individual holds one or more jobs would also effect the potential, but this effect is unknown. Rural areas tend to have a higher fraction of individuals who are self-employed and the ability to pull them into employment may not be as high as in urban areas. Base population = civilian employed population 16+. 5.1 Annual data. Apprenticeships completed per year. On-going research. 5.2 Annual data. The number of internships completed each year. No state or county data is available for internships. The estimates provided here are based on the author's research on internships at one large Midwest university (2015-18 data). Internship locations were first correlated with county civilian labor force and RUCC data and then county estimates were made across the U.S.. A second estimate was made based on county-level data on the number of students enrolled in four-year colleges and graduate schools (2018-22) and various studies on the fraction of students who complete an internship. These values were then adjusted in some cases to address outliers (e.g. small population counties with universities). Both estimates were then scaled to match national estimates of the number of annual internships. These two different approaches were then averaged to get the results presented here. Base population = CLF 16+. 5.3 Youth programs include 4-H, Boy Scouts, Girl Scouts, and FIRST LEGO League participants. Values are the total number of individuals participating in a given year, which covers individuals in different years in school. Data on these programs is not available across the country, so estimates are made using Iowa data. The county participation estimate is based on the number of youth 5-17 in the county in 2018-2022 and the 2014-2018 Iowa participation rate data. The workforce potential assumes the standard deviation of the U.S. county participation rate is the same as the 2014-18 SD for Iowa. Base population = Population 5-17. Back to Resources
- Workforce Potential | Midwest Workforce Strategies
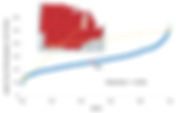
The workforce potential is a data-based estimate of a reasonable increase in labor force participation rate by specific types of individuals. SM Workforce Potential SM Workforce Potential Prioritize Your 40 Talent Pools Based on Local Availability Workforce Potential SM The Workforce Potential is the number of additional individuals your community might be able to pull into the local labor force. The workforce potential has 40 different components, specifically, the number of new employees in each of the nearly 40 different types of individuals (Workforce Elements ). For example, the workforce potential for your county will estimate how many more veterans you might be able to pull into the local workforce, how many individuals with a disability you might be able to hire, the number of males 25-54 years old, etc. To create the Workforce Potential , we compare your county with the 3,143 U.S. counties and the District of Columbia. Below is one of 40 workforce potential graphs, each representing a different subset of the labor force. The 3,000+ counties are ranked from the worst (rank = 0) to the best (rank = 1) in terms of the fraction of individuals either working or not working. In this example, the fraction of Individuals with a Disability who are not in the labor force varies from about 90% for the lowest-performing counties to about 10% for the best counties . This data can be used to compare your county with your aspirational peers - the counties that look like yours regarding the fraction of individuals working but that have a slightly higher labor force participation rate. For the case of Individuals with a Disability, we can use the estimate of an improved participation rate for this subset of individuals, together with the number of individuals with a disability in your county, to calculate a reasonable number of additional individuals with a disability you might be able to pull into the local workforce. This process is repeated for the 39 other workforce elements. A 10% improvement in rank (from the median value) is used for all 40 elements to allow better comparisons between workforce elements. This information can then be used with other local information to decide which labor pools are likely the largest and which pools you may be best equipped to attract to your organization. Since all potentials are relative, they can be scaled up or down. If your organization employs 1% of all individuals in the county, multiplying the values by 1% will give a better estimate of possibilities. Of course, your efforts versus your competitions' efforts also affect the outcomes you achieve. Keep in mind that there are variations in the potential between categories. Some are annualized numbers, while others are totals. Also, the time to make changes can vary from months to years. It is best to begin by comparing potentials within each category. The next step in the process is to understand and address the various cons traints preventing the different types of individuals from working for you. T he Workforce Root Cause Matrix links the 40 Workforce Elements to the 25 root causes that can limit hiring success and retention. Back to the Workforce Vector
- Let's Talk Strategy | Midwest Workforce
Let's talk if you need an engaging keynote and breakout sessions or a workforce strategic planning session for your Leadership Team. Contact Us: Let's Talk Strategy Move from Reactive Hiring to a Permanent Solution "Workforce stability isn't found in the latest hiring trend or a temporary patch. If you are ready to move past reactionary hiring and invest in a data-driven, long-term roadmap, let’s talk. This call is for leaders committed to building a permanent solution for their labor needs." Booking options Keynotes & Workshops Conferences and Associations In-person or virtual delivery, customized to your event scale. Every keynote integrates current, region-specific labor data. Workshop participants leave with a draft of their Workforce Strategic Roadmap. Book a Keynote Executive Strategy Leadership Teams Align leadership on current and future workforce issues with a vision-setting keynote. Develop strategies using the Balanced Scorecard framework. Shift from reactive hiring to a sustainable, long-term workforce roadmap. Book a Planning Session Community Planning Economic Developers Facilitate unified planning for city managers and business leaders. Leverage county-specific data to guide policy and strategy. Identify and engage the hidden workforce to increase labor participation rates. Book a Community Session Discovery Call Custom Needs Pinpoint your primary workforce bottlenecks in a 15-minute diagnostic. Receive immediate, actionable next steps to resolve critical gaps. Determine the right engagement model for your timeline and budget. Schedule a Discovery Call Form Top Service Category Which service are you interested in?* Required Fields First name* Last name* Email* Company or Organization name* Location & Date (If Known) Date Month Day Year Discovery Call or Zoom/MS Teams Meeting Information Phone First Choice for Call/Meeting Second Choice for Call/Meeting Submit
- Workforce Elements | Midwest Workforce Strategies
Workforce Elements are the 40 different types of individuals you could target to grow your organization. The 40 Workforce Elements Identifying the Untapped Talent Pools Your Competitors Miss The components of the Workforce Vector are termed the Workforce Elements . The 40 elements fall into five business and Human Resource categories: Increasing the output of your current employees; Retaining your current employees; Hiring individuals who are not employed, under-employed, or unemployed; Attracting individuals employed by others; and Building your future workforce. Broad descriptions of the five categories are described below. D etailed definitions of the 40 workforce elements can be found here . 1. Employee Output: The first workforce category involves increasing the productivity of your current employees so you can reduce the number of new employees you need to hire. These productivity enhancements are split into three elements. a) Capital Investments – Increasing the output of your employees by investing in intellectual property and equipment. b) Labor Composition – Increasing the output of your employees by improving their level and mix of education, skills, and experience. c) Process Improvements - Improving processes using tools like Lean to increase employee output. 2. Retention: The second category covers the retention of current employees, which reduces the need to hire new employees. There are three elements in the retention category. a) Employee Retention - Reducing the number of team members that are quitting and those being discharged (fired). b) Layoffs - Individuals being laid off because of non-steady demand for products or services, but may need to be replaced at some point in the future. c) Out-migration - Individuals quitting and then moving out of the county. These individuals are included in the workers who have left an organization but are examined separately because special strategies may need to be implemented to successfully retain these individuals in the community. 3. Not in the Labor Force: The third category includes individuals who are not working. They are broken into two broad groups. a) Individuals categorized by age. A few age brackets are further split based on gender and status as a student. b) Individuals categorized in some way that typically crosses age brackets. Examples include individuals with a disability, individuals recently incarcerated, individuals with income below the poverty level, individuals without a college degree, Latinos, veterans, and volunteers. These are studied separately because: i) they may need to have subset-specific accommodations addressed before finding suitable employment; or ii) special strategies may need to be developed to succeed at recruiting this sub-group of individuals. 4. Employed Elsewhere: The fourth category includes individuals employed elsewhere, often outside the county. They are broken into three broad groups. a) Individuals typically employed outside the county. This includes individuals who could in-commute to a job in your county and those who may be persuaded to stop out-commuting to a job in a nearby county. It also includes remote workers - individuals at a primary work location different from the normal place of business in the county. b) Migrators - Individuals who are migrating to your county for employment from another county in your state (in-state migration), another state (out-of-state migration), and another country (international migration and refugees). c) Individuals employed in the county. This includes contract employees (Gig workers, Temp workers, ...), converting part-time employees to full-time status, poaching employees from competitors, hiring individuals who want a second job, and enticing local small business owners to transition away from self-employment. 5. Future Employees: The fifth category involves developing your future workforce pipeline. This could involve a variety of strategies like school partnerships, tours of businesses, and participation in youth development activities. We include three elements in this K-22 category: a) Apprenticeship programs; b) Internships; and c) Youth programs that include skills development on topics like leadership, public speaking, and problem-solving. This work focuses on Boy Scouts, Girl Scouts, 4-H, and First Lego League. After individuals are split into these 40 different elements, we proceed to quantify the potential to increase the labor pool of each. This is termed the W orkforce Potential . Back to the Workforce Vector
- Privacy Policy | Midwest Workforce
Privacy policy for the Midwest Workforce Strategies website. Privacy Policy Privacy policy for www.MidwestWorkforce.com Last updated: 8/11/2023 Welcome to www.midwestworkforce.com (the "Website"), operated by Midwest Workforce Strategies, LLC ("we," "us," or "our"). We value your privacy and want to ensure that you understand how we collect, use, and protect your personal information. This Privacy Policy explains our practices concerning the information collected through the Website. By accessing or using the Website, you consent to the terms of this Privacy Policy. 1. Information We Collect 1.1. Personal Information: We may collect personal information that you provide directly to us when you interact with the Website. This may include but is not limited to, your name, email address, postal address, phone number, and any other information you choose to provide. 1.2. Usage Information: We may collect information about your interactions with the Website, including your IP address, browser type, device information, pages visited, and other usage data. This information helps us analyze trends, improve the Website, and enhance user experience. 2. How We Use Your Information 2.1. Providing Services: We use the information we collect to respond to your inquiries and improve the website. 2.2. Marketing: We will not send you automated promotional materials or newsletters. We may periodically email you to inquire whether you need further assistance or to inquire about the quality of our services. 3. Data Sharing and Disclosure 3.1. Service Providers: We may share your information with third-party service providers who help us operate the Website and provide related services, such as invoicing. These providers are required to maintain the confidentiality of your information. 3.2. Legal Reasons: We may disclose your information if required by law, such as in response to a valid court order or government request. 4. Security We implement reasonable measures to protect the security of your information. However, please be aware that no method of transmission over the Internet or electronic storage is 100% secure. 5. Your Choices You can request that your personal information be deleted by emailing ron.cox@midwestworkforce.com . 6. Child Privacy Our website is not intended for use by children under the age of 18. If you are under the age of 18, please do not use our website or provide any personal information. We do not knowingly collect personal information from children under 18. If you are a parent or guardian and believe that we have collected personal information from your child without your consent, please contact us immediately so that we can take appropriate steps to remove such information and ensure COPPA compliance. [1] By using our website, you represent that you are 18 years old or older. 7. Changes to this Privacy Policy We may update this Privacy Policy from time to time. The date of the latest revision will be indicated at the top of the policy. 8. Contact Us If you have any questions or concerns about this Privacy Policy, please contact us at ron.cox@midwestworkforce.com . [1] Children's Online Privacy Protection Act
- Ron Cox | Midwest Workforce Strategies
Dr. Ron Cox applies the rigorous mathematics of aircraft design to solve complex labor market challenges. As the president of Midwest Workforce Strategies and inventor of the Workforce Vector, Ron moves organizations beyond guesswork, using data analytics to help executives and boards engineer lasting retention and recruitment solutions. Dr. Ron Cox President, Midwest Workforce Strategies and Inventor of the Workforce Vector Ron Cox applies the rigorous mathematics of aircraft design to solve complex labor market challenges. As the president of Midwest Workforce Strategies and inventor of the Workforce Vector framework, Ron moves organizations beyond guesswork, using data analytics to help executives and boards engineer lasting retention and recruitment solutions. Ron’s unique perspective is built on a dual career in engineering design and economic development. He began his career in aerodynamics, working on military aircraft and early testing for the Boeing 757 and 767. He transitioned to academia and leadership as the Director of the Iowa State University Center for Industrial Research and Service (CIRAS), where he managed a $9 million budget and led a team serving 1,500 companies annually. Under his leadership, clients reported an annual economic impact of over $600 million and the creation or retention of 5,000 jobs. His operational expertise runs deep, with previous administrative oversight of engineering, HR, finance, IT, and online education units.University of Oklahoma students voted Ron "Teacher of the Year", and today he is a "Legend in Manufacturing" award winner and a sought-after keynote speaker. He delivers talks on workforce topics such as "The Workforce Hype Cycle," helping diverse industries, from manufacturing to healthcare, turn workforce shortages into competitive advantages. Download Full Curriculum Vitae (PDF) Let's Connect I'm always happy to discuss workforce issues and opportunities. Let me know how I can help. Ron.Cox@MidwestWorkforce.com 515-715-6438 Follow me:
- Midwest Region Data | Midwest Workforce Strategies
Select a midwest region county and Workforce Vector data is displayed. States include North Dakota, South Dakota, Nebraska, Kansas, Minnesota, Iowa, Missouri, Wisconsin, Illinois, Michigan, and Indiana. Midwest Region Workforce Vector Data Type your county name in the dropdown menu and then select it from the list. Workforce Vector data for your county will be displayed in the tables. [See Note A below.] Workforce Vector FAQs, definitions, and notes are included beneath the Workforce Vector tables. These pages need to be viewed on a desktop computer. The mobile-friendly version is still in development. NOTE: This is PRELIMINARY data and is subject to change . [See Note B below.] Jump to the Northeast Region Jump to the South Region Jump to the West Region Workforce Element Definitions Workshop Materials Filter by County County: General Information 0.1 Population 0.2 Population 16+ 0.3 Civilian Labor Force 16+ County Total County: Employee Output/yr 1.1 Capital Investments 1.2 Labor Composition 1.3 Process Improvements % GDP/yr Rank ENE/yr Workforce Potential/yr County: Retention/yr % Emp./yr Rank Employed/yr Workforce Potential/yr 2.1 Quits and Discharges/year 2.2 Layoffs/year 2.3 Out-Migration Rate/year Population Population Population Population Population Population Population Population County: Not in Labor Force % Not in LF Rank # not in LF Workforce Potential 3.1 Students 14-15 [ Warning! See notes.] 3.2 Non-Students 16-19 3.3 Students 16-19 3.4 Females 20-54 3.5 Males 20-54 3.6 Individuals 55-74 3.7 Females with Children < 6 3.8 Foreign Born - Naturalized Citizens 3.9 Foreign Born - Not a U.S. Citizen 3.10 Individuals with a Disability 3.11 Indiv. Experiencing Homelessness 3.12 Indiv. with Income < Poverty Level 3.14 Individuals Recently Incarcerated 3.15 Latinos 3.16 Part-time Employees 3.17 Unemployed [*] 3.18 Veterans 3.19 Volunteers (FTE) 3.13 Indiv. without a College Degree Population Population Population Population County: Employed Elsewhere % Base Rank Employed Workforce Potential 4.1 In-commuters 4.2 Out-commuters [ Warning! See notes.] 4.3 Remote Workers 4.4 In-state Migration/year 4.5 Out-of-state Migration/year 4.6 International Migration/year 4.7 Refugees/year 4.8 Contract / Temp Workers 4.9 Part-time to Full-time Employees 4.10 Poaching/year 4.11 Second-job Employees 4.12 Self-employed Individuals Population Population Population Population Population Population Population Population Population Population Population Population Population Population Population Population County: Future Employees % Base Rank Total Workforce Potential 5.1 Apprenticeships/year Population 5.2 Internships 5.3 Youth Programs Population Population Population FAQs How can I learn more about what these numbers mean? There are a number of resources on the site to help explain the Workforce Vector and how it is used to help organizations grow their workforce. The 40 workforce elements (the rows in the tables above) are described here . The potential to increase employment of each type of individual is described here . Can we talk about how this can help me find employees? If you would like to have a brief conversation about how this data can be used to increase or retain your workforce, send me an email at ron.cox@midwestworkforce.com or contact me through my website contact form . How accurate are these numbers? CAUTION! The numbers provided here are approximations and should only be used to get a sense of local conditions and possibilities. The data should only be used to compare and contrast options and to guide the user as they explore more local and more timely information. The data is not exact for the following reasons. The Federal data are approximations based on surveys. All values have an error bound, meaning the result displayed is the best estimate but there is a chance the actual value is different, but within some error bound. For instance, a county estimate for a group size could be 120 with a margin of error of 75. The value 120 is the estimate of the group size (displayed in the table above) and the 75 is the margin of error. See www.bls.gov for more information on margins of error and confidence level. Error margins are not included in the table above. Note that the accuracy of the estimates tend to be better (lower margin of error as a percent of the estimate) for larger populations where the sampling size is larger. Estimates for low population counties tend to have much higher error ranges as a percent of the estimate. Five year averages are given for the majority of the values in the table. This is done to reduce the short-term fluctuations in the data and because data is not released annually for small counties because of the small sample size. Some data is not known at the county level, so statewide or national values for some variables are used in conjunction with local data (if available) to estimate local conditions. The errors in these estimates are greater when local conditions differ significantly from the state or national averages used in the calculations. Definitions (*): An asterisk indicates the workforce vector values shown (except for the potential) are an average of a portion of the counties in the state. This generally arises for small counties when Federal data is not available. See the FAQs (above) and the specific workforce element note (below). ENE: Equivalent New Employees per year. FTE: Full Time Equivalent. Labor Force: Individuals employed and unemployed. NA: Data not available. NILF: Not In the Labor Force % Not in the LF: The fraction of the civilian population 16+ that is not in the labor force. They are not employed nor are they unemployed. Population: Table entries marked as 'Population' are currently being created and will be updated over the next several months. RUCC: Rural-Urban Continuum Codes. Workforce Potential: The number of additional individuals that might be able to be pulled into a county's labor force if productivity, hiring, and retention rankings are improved by 10% from the median county values. Rank: The county place within all U.S. counties in terms of the percent employed. 1% = Top 1% (highest fraction employed or lowest fraction not in the LF); 100% = 99-100% (lowest fraction employed or highest fraction not in the LF). Workforce Element Notes Alphabetical general notes are listed first. These are followed by notes specific to each workforce element. Additional information will be added to the notes in the coming months. Notes will change over time as research continues. [A] The government combines some data areas so your ‘County’ name listed here may be slightly different. This applies to Alaska, Connecticut, and Virginia. Data for U.S. territories is not included in this work. [B] This work is on-going research and will change over time. All of the numbers presented here have errors of varying magnitudes. These errors occur because of the statistical modeling used by those creating the data, by changes in data over time, by the use of national or state-level data for county level information when data at the local level is not known, and by estimates made by the author when certain information is not known at the local level. See the FAQs above for more information. Some estimates of workforce element data are questionable and extreme caution should be used. Typically this occurs when there are very large variations in a quantity and the definition of the term and the actual data gathered by BLS or the Census Bureau differs. Additional errors can occur when local data is not available and state or national averages are used to arrive at an order of magnitude for a term. An example is Out-commuting. See 4.2 below. 0.1 Average of 2018-2022 county data. Population 0+ years old. 0.2 Average of 2018-2022 county data. Population 16+ years old. 0.3 Average of 2018-2022 county data. Civilian employed and unemployed 16+. 1.1 Annual data. Least-square linear fit to 2013-2022 state productivity data. State data is adjusted slightly to approximate county-level productivity changes. A limiter is applied to an annualized 2013-2023 GDP/hr county estimate to constrain the variation off of the state average. Annualized percent changes in county GDP/hr are split into capital, composition, and TFP components by assuming every county looks like the national average splits. The county estimate for capital may be higher or lower than the value shown because of the county mix of industry, labor, and other factors compared with the national and state averages of industry, labor, and other factors. The equivalent number of new employees is the percent GDP/hr change multiplied by the employment level (2018-2022 data). Base population = Employed 16+. 1.2 Annual data. Least-square linear fit to 2013-2022 state productivity data. State data is adjusted slightly to approximate county-level productivity changes. A limiter is applied to an annualized 2013-2023 GDP/hr county estimate to constrain the variation off of the state average. Annualized percent changes in county GDP/hr are split into capital, composition, and TFP components by assuming every county looks like the national average splits. The county estimate for capital may be higher or lower than the value shown because of the county mix of industry, labor, and other factors compared with the national and state averages of industry, labor, and other factors. The equivalent number of new employees is the percent GDP/hr change multiplied by the employment level (2018-2022 data). Base population = Employed 16+. 1.3 Annual data. Least-square linear fit to 2013-2022 state productivity data. State data is adjusted slightly to approximate county-level productivity changes. A limiter is applied to an annualized 2013-2023 GDP/hr county estimate to constrain the variation off of the state average. Annualized percent changes in county GDP/hr are split into capital, composition, and TFP components by assuming every county looks like the national average splits. The county estimate for capital may be higher or lower than the value shown because of the county mix of industry, labor, and other factors compared with the national and state averages of industry, labor, and other factors. The equivalent number of new employees is the percent GDP/hr change multiplied by the employment level (2018-2022 data). Base population = Employed 16+. 2.1 Annual data. On-going research. 2.2 Annual data. On-going research. 2.3 Annual data. Average of 2018-2022 county data. Fraction of the population 0+ that out-migrates each year. The number of out-migrators is adjusted lower by the identical amount in every county, by a national estimate, to approximate the number of employees that leave each county annually. This is on-going research and this number may be adjusted lower. Base population = population 0+. 3.1 The Students 14- to 15-years-old workforce element should be used with caution since there is very little research data available. The 14-15 population size is estimated from a 10-14 population value and a 15-17 value. The unemployment rate is assumed to be the same as the rate for the population 16-19, based on research prior to 2000. The employment participation rate is estimated to be a fraction of the 16-19 rate, based on research prior to 2000. There are many root causes associated with the 14-15 age group, which make it difficult for individuals to find employment. This group is much more likely than other groups to work part-time and part-year, which further limits the impact the group can have on the local labor force. Average of 2018-2022 county population data. Base population = Population 14-15 estimate. 3.2 Average of 2018-2022 county population data. Base population = Non-student population 16-19. 3.3 Average of 2018-2022 county population data. Base population = Student population 16-19. 3.4 Average of 2018-2022 county population data. Base population = Female population 20-54. 3.5 Average of 2018-2022 county population data. Base population = Male population 20-54. 3.6 Average of 2018-2022 county population data. Base population = Population 20-54. 3.7 Females 20-64 with children less than six years old. Average of 2018-2022 data. Base population = Civilian females 20-64. 3.8 Data is only available at the county level for large-population counties. This data, together with the state average, is used to compute an average value for the fraction of the foreign-born not in the labor force in the small-population counties. When error bounds lead to a large variation in the estimate for the small-county average, the NILF estimate is limited to 1.5 standard deviations (of all states) from the state average. An asterisk (*) is used to indicate when a small-county average is used. Small counties with industries that tend to hire more/fewer foreign-born individuals will likely have a greater/smaller value of those not in the labor force than indicated by the average. Average of 2018-2022 state and county population data. Base population = Foreign-born - naturalized citizen population 16+. 3.9 Data is only available at the county level for large-population counties. This data, together with the state average, is used to compute an average value for the fraction of the foreign-born not in the labor force in the small-population counties. When error bounds lead to a large variation in the estimate for the small-county average, the NILF estimate is limited to 1.5 standard deviations (of all states) from the state average. An asterisk (*) is used to indicate when a small-county average is used. Small counties with industries that tend to hire more/fewer foreign-born individuals will likely have a greater/smaller value of those not in the labor force than indicated by the average. Average of 2018-2022 state and county population data. Base population = Foreign-born - not a U.S. citizen population 16+. 3.10 Average of 2018-2022 county data. Base population = Individuals with a disability 18-64. 3.11 This data is for the sheltered homeless, which is about one-half of all individuals experiencing homelessness. Some of the sheltered homeless are in the labor force, so the number NILF is less than the total in shelters. There is no data at the state or county level on the fraction of the sheltered homeless that are not in the labor force. The value provided here is an estimate based on 1) state data (2018-2022) on the fraction of the state population in shelters, 2) national data on the fraction of the sheltered homeless 16+ years old (assumed to hold in all counties), 3) the national value for those in shelters who are not in the labor force (assumed to hold in all counties), and county data on the population 16+ (2018-2022). The workforce potential is computed using a different approach because of the lack of NILF data. The potential is the increase in labor available if homelessness decreases in comparison to peers. The potential value is low in part because some of those in shelters are already employed. Since the fraction of individuals experiencing homelessness tends to be higher in urban areas, urban data is likely under-estimated and rural data is likely over-estimated. Base population = population 16+. 3.12 Individuals with income less than the poverty level. Average of 2018-2022 data. Base population = Civilian labor force 16+. 3.13 Individuals without a college degree only includes those without a high school degree and those with a high school degree that did not complete any higher education courses. Individuals who completed some college-level courses but did not get a degree are not included. Average of 2018-2022 county data. Base population = Individuals 25-64 with high school as the highest degree. 3.14 On-going research. 3.15 Average of 2018-2022 county population data. Base population = Latino civilian population 16+. 3.16 Average of 2018-2022 county data. The 'Not in Labor Force' value is all individuals 16+ not in the labor force. It is assumed that individuals entering the labor force will distribute more favorably to part-time employment. Specifically, to the average of a) completely part-time and b) the county ratio of part-time to full-time employment. Base population = Population 16+. 3.17 Average of 2018-2022 county data. The unemployed are technically considered to be in the labor force. The other workforce elements in this category highlight those that are not in the labor force. That is, individuals who are neither employed nor unemployed. The county unemployment rate is shown in the '% Not in LF' column. Base population = Civilian population 16+. 3.18 Average of 2018-2022 county data. Base population = Veterans 18-64. 3.19 A verage of 2018-2022 county data on the population 16+. Volunteering rate is an average of 2017, 2019, and 2021 data. Volunteer data is only known at the state level so it is assumed that the county volunteer rate equals the state average. The non-volunteer rate is shown in the '% Not in LF' column. The '# Not in LF' and the Workforce Potential are converted to an equivalent, fully-employed person using the national average of the number of volunteer hours per volunteer. 4.1 On-going research. 4.2 Average of 2018-2022 county population data. The out-commuting workforce element is known to have large errors. Differences in remote work, hybrid work, and other work-location situations impact government survey results, so caution should be used when reviewing results. In addition, the ability to change commuting patterns can be difficult in certain situations. For instance, when a professional is commuting from a small county with poor job fit opportunities to a nearby metropolitan area. The ability to change this commuting behavior is less than what would be predicted by the perturbation methods used in this work to estimate potential changes. Base population = Employed 16+. 4.3 Average of 2018-2022 county data. Includes individuals who usually worked from home, so this includes some hybrid work. Remote work varies by industry, so variations in industry mix by county will affect the potential calculation. As such, the potential should be considered an upper estimate. Base population = Employed 16+. 4.4 Annual data. Average of 2018-2022 county data. The in-state migration rate is the number of individuals moving to the county per year from within the state, as a percent of the county population 1+. The in-state migration rate is a modified rate to adjust for states with (typically) one very large population county compared to the rest of the population in the state. The number of migrators is adjusted lower by an identical amount in every county, by a national estimate, to approximate the number of employees migrating. This is on-going research and this number may be adjusted lower. Base population = population 1+, adjusted for county population skew. 4.5 Annual data. Average of 2018-2022 county data. The in-migration rate is the number of individuals moving to the county from other states per year, as a percent of the county population 1+. The number of out-of-state migrators is adjusted lower by an identical amount in every county, by a national estimate , to approximate the number of employees migrating. This is on-going research and this number may be adjusted lower. Base population = population 1 +. 4.6 Annual data. Average of 2018-2022 county data. The immigration rate is the number of individuals moving to the county from other countries per year, as a percent of the county population 1+. The number of immigrates is adjusted lower by an identical amount in every county, by a national estimate , to approximate the number of employees migrating. This is on-going research and this number may be adjusted lower. Base population = population 1 +. 4.7 Annual data. Average of data from 2018-2022 for county population and from 2013-2023 for refugees/year. Assumes refugees are distributed proportional to the local population. When refugees arrive, they often are more concentrated in counties that have more Federal and local resources. See: https://www.acf.hhs.gov/orr/map/find-resources-and-contacts-your-state. Refugee estimates are likely over-estimated in counties with few resources and under-estimated in counties with more settlement resources. The number of refugees is adjusted lower by an identical (national) amount in each county to approximate the number of refugees that will be in the labor force. This is on-going research and this number may be adjusted lower. Base population = Population 0+. 4.8 On-going research. 4.9 Average of 2018-2022 county data. The potential is the conversion of current part-time employees to full-time employees, not new full-time employees from those not-employed. Base population = Full-time and Part-time/Part-year population 16+. 4.10 On-going research. 4.11 On-going research. 4.12 County estimates for the number of self-employed (SE) individuals with no employees are made by using 1) 2018-22 county data on the number of employed civilians 16+, 2) 2018-22 county data on the number of SE by incorporation status and gender, 3) 2015 national data on the fraction of the SE without employees by incorporation status, and 4) 2019 data on the fraction of the SE with no employees by gender. The potential value is likely an upper-estimate due to how industry mix affects the local self-employment rate. Whether a self-employed individual holds one or more jobs would also effect the potential, but this effect is unknown. Rural areas tend to have a higher fraction of individuals who are self-employed and the ability to pull them into employment may not be as high as in urban areas. Base population = civilian employed population 16+. 5.1 Annual data. Apprenticeships completed per year. On-going research. 5.2 Annual data. The number of internships completed each year. No state or county data is available for internships. The estimates provided here are based on the author's research on internships at one large Midwest university (2015-18 data). Internship locations were first correlated with county civilian labor force and RUCC data and then county estimates were made across the U.S.. A second estimate was made based on county-level data on the number of students enrolled in four-year colleges and graduate schools (2018-22) and various studies on the fraction of students who complete an internship. These values were then adjusted in some cases to address outliers (e.g. small population counties with universities). Both estimates were then scaled to match national estimates of the number of annual internships. These two different approaches were then averaged to get the results presented here. Base population = CLF 16+. 5.3 Youth programs include 4-H, Boy Scouts, Girl Scouts, and FIRST LEGO League participants. Values are the total number of individuals participating in a given year, which covers individuals in different years in school. Data on these programs is not available across the country, so estimates are made using Iowa data. The county participation estimate is based on the number of youth 5-17 in the county in 2018-2022 and the 2014-2018 Iowa participation rate data. The workforce potential assumes the standard deviation of the U.S. county participation rate is the same as the 2014-18 SD for Iowa. Base population = Population 5-17. Back to Resources
- Workforce Root Cause Matrix | Midwest Workforce Strategies
The workforce root cause matrix is the linkage between the nearly 40 types of people you could hire and the root causes preventing them from working for you. The Root Cause Matrix Linking Talent Pools to Hiring Barriers The Workforce Root Cause Matrix links the 40 workforce groups (elements) to the 25 possible root causes limiting your success at hiring each specific type of individual. To grow and retain your workforce, you must first address the group-specific root causes that are preventing individuals from working for you. Some root causes, like wages and benefits, affect many workforce elements. Improving this one root cause can help you attract many different types of individuals. Others, like English as a Second Language training, affect many fewer workforce elements but may be equally important for success if you normally recruit from groups affected by this root cause. The resources and time required to improve your selected root causes will depend on how well you address the items compared to your competition. Root causes like organization-specific internal policies can be addressed much easier than more complex root causes, like many of those associated with migration. The Human Resources team usually cannot resolve company-specific root causes alone. Engagement across the leadership team will likely be required. The table below highlights the root causes that have surfaced in the research to date. These are listed in alphabetical order, with the exception of marketing. Marketing is listed last since it should be the last item addressed in the Workforce Vector process. You can think of the Workforce Root Cause Matrix as 25 rows and 40 columns in an Excel spreadsheet. The cells represent the possible connectivity between a specific workforce element and a single root cause. Though there are 1,000 possible connections, in reality 60% of the matrix is empty - there are no connections. This means, on average, about 40% of the root causes could affect the hiring from one workforce element group. For example, as you try to hire an individual that falls into a single workforce element (e.g. Females with children < 6 years old ), there may be about ten different root causes reducing or preventing a successful hire and retention. Fortunately, not all of an element's root causes affect hiring to the same degree and some root causes may not apply in your community or to your organization. That is, some organizations can increase the size of their hiring pool by addressing just a few root causes. As well, a specific individual likely would not be affected by all of the root causes associated with the workforce element they are aligned with. In the example of Females with children < 6 years old, the root cause of affordable child care may be the only constraint preventing some individuals with young children from entering the workforce. The graphi c below depicts the general form of the matrix. Note: The Workforce Root Cause Matrix is proprietary information. It is provided to workshop attendees and to leadership team members during planning sessions. See Services . Back to the Workforce Vector
- County Data | Midwest Workforce Strategies
Select a U.S. county and Workforce Vector data is displayed. The table includes information for the nearly 40 workforce elements, including the number of individuals by type, the fraction employed, how the county ranks compared to all U.S. counties, and an estimate of the potential to increase employees. County Workforce Data Benchmarking Your Region How does your county rank in hiring across the 40 workforce types? Where is the greatest potential to find new employees? Three steps to get answers to these questions and more. 1. Attend an event and receive an access code. This will give you access to the Workforce Vector data for all 3,143 U.S. counties and D.C. 2. Click on the U.S. region below that includes your county and enter the access code. This will take you to your regional page. 3. Type your county name in the dropdown menu and click on your county. Workforce Vector data for your county will be displayed in a table. Back to Resources SEO Link - M SEO Link - N SEO Link - S SEO Link - W SEO Link - M SEO Link - N SEO Link - S SEO Link - W Back to the Workforce Vector