
Midwest Workforce Index
Is it getting easier or more difficult to find new employees?
SM
Release Date: July 7, 2026
May 2026 MWI drops to 45.0
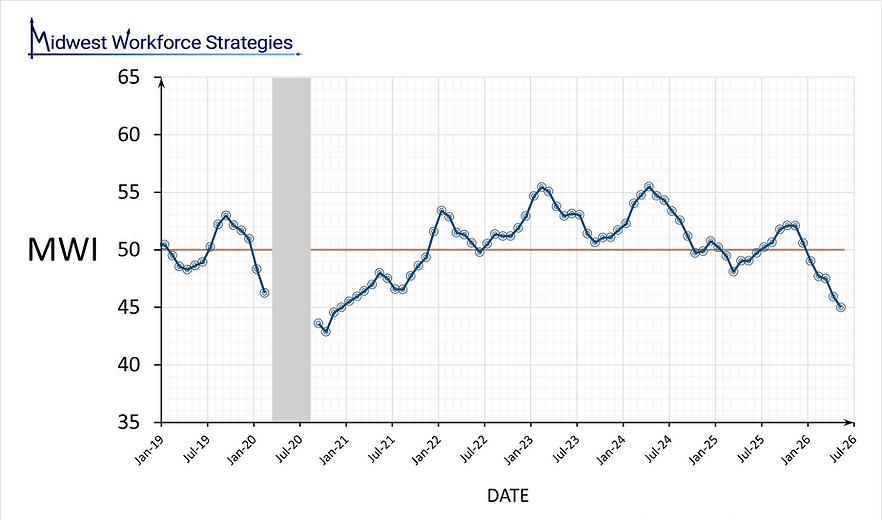
The preliminary May 2026 Midwest Workforce Index (MWI) stands at 45.0, its lowest level since December 2020, when businesses nationwide began struggling to find employees post-COVID. The MWI is a concise monthly measure of changing hiring conditions in the Midwest, where values above 50 indicate that hiring was easier than the previous month. The current reading suggests that hiring in the region became significantly more difficult in May compared to April.
Starting in September 2024, the MWI remained within two points of 50 for 17 consecutive months, indicating that employment availability was virtually unchanged from mid-2024 through early 2026. Although the index last peaked in October 2025, it has now declined for seven straight months. The MWI has not seen such a sustained drop since the period between mid-2019 and the pandemic-driven recession in early 2020. (See the chart below.)
Industries like health services and utilities have added jobs recently, but far more industries have either experienced flat job growth (government, trade, leisure and hospitality, manufacturing, transportation) or seen declines (finance and real estate, construction, and information). Given the continuing structural reductions in the labor pool (immigration declines and Baby Boomer retirements), any future economic growth will likely lead to a return of hiring difficulties. We can expect to see the first signs of a tightening labor market in lower-wage sectors like leisure and hospitality and social assistance.
Is this recent drop an anomaly? Check back in a few months, and we will have a much clearer picture of how hiring may look for companies trying to grow in late 2026.
Note on Methodology: The index data is not displayed for the period immediately following the 2020 recession due to the extreme volatility of the underlying indicators during that time. Research is ongoing to better represent this period.
Regional Variance: The MWI represents the entire Midwest region. Local migration patterns, industry mix, and other demographic variations will affect specific markets; therefore, the MWI may not perfectly reflect local experiences.

MWI Time Series (2019-2026)
Note: This is preliminary work. Past values will change as the research continues.